
Illustration: Despite 6 consecutive interest rate cuts, the interest rate outlook is trending upward


In September 2024, the Fed officially started cutting rates. At that time, the median dot plot drew a clear line: end of 2025 at 3.4%, with 4 more cuts to come.
6 quarters have passed. Last night's March SEP told us that this line has completely gone awry.
The Fed kept rates unchanged at 3.50%-3.75%, no surprise to the market. But what happened inside the dot plot is more worth dissecting than the rate decision itself. Out of 19 members, 7 thought there should be no rate cut this year, 7 thought there should be 1 cut. Perfectly split. The median remained the same, but the consensus fell apart.
With the three charts below, we can easily understand how the Fed has step by step adjusted its expectations to reality, the extent of internal discord, and why their inflation forecast is likely underestimated once again.
Collapse of Rate Cut Expectations
According to the Fed's official SEP data, in September 2024 when the rate cut started, the dot plot's median forecast for the end of 2025 was 3.4%, implying 4 more cuts from the then range of 4.75%-5.00%.
Three months later, in December SEP, this number jumped to 3.9%. Only 2 cut spaces left. Subsequent updates in March, June, September, and December 2025 did not bring the end of 2025 forecast back to 3.4%. The actual year-end rate in 2025 fell in the range of 3.50%-3.75%, a full 25 basis points higher than the initial expectation at the start of the rate cut.
The forecast for 2026 followed the same path. In September 2024, the Fed expected the end-of-2026 rate to drop to 2.9%. By last night's March SEP, this number stabilized at 3.4%, 50 basis points higher than the initial expectation.
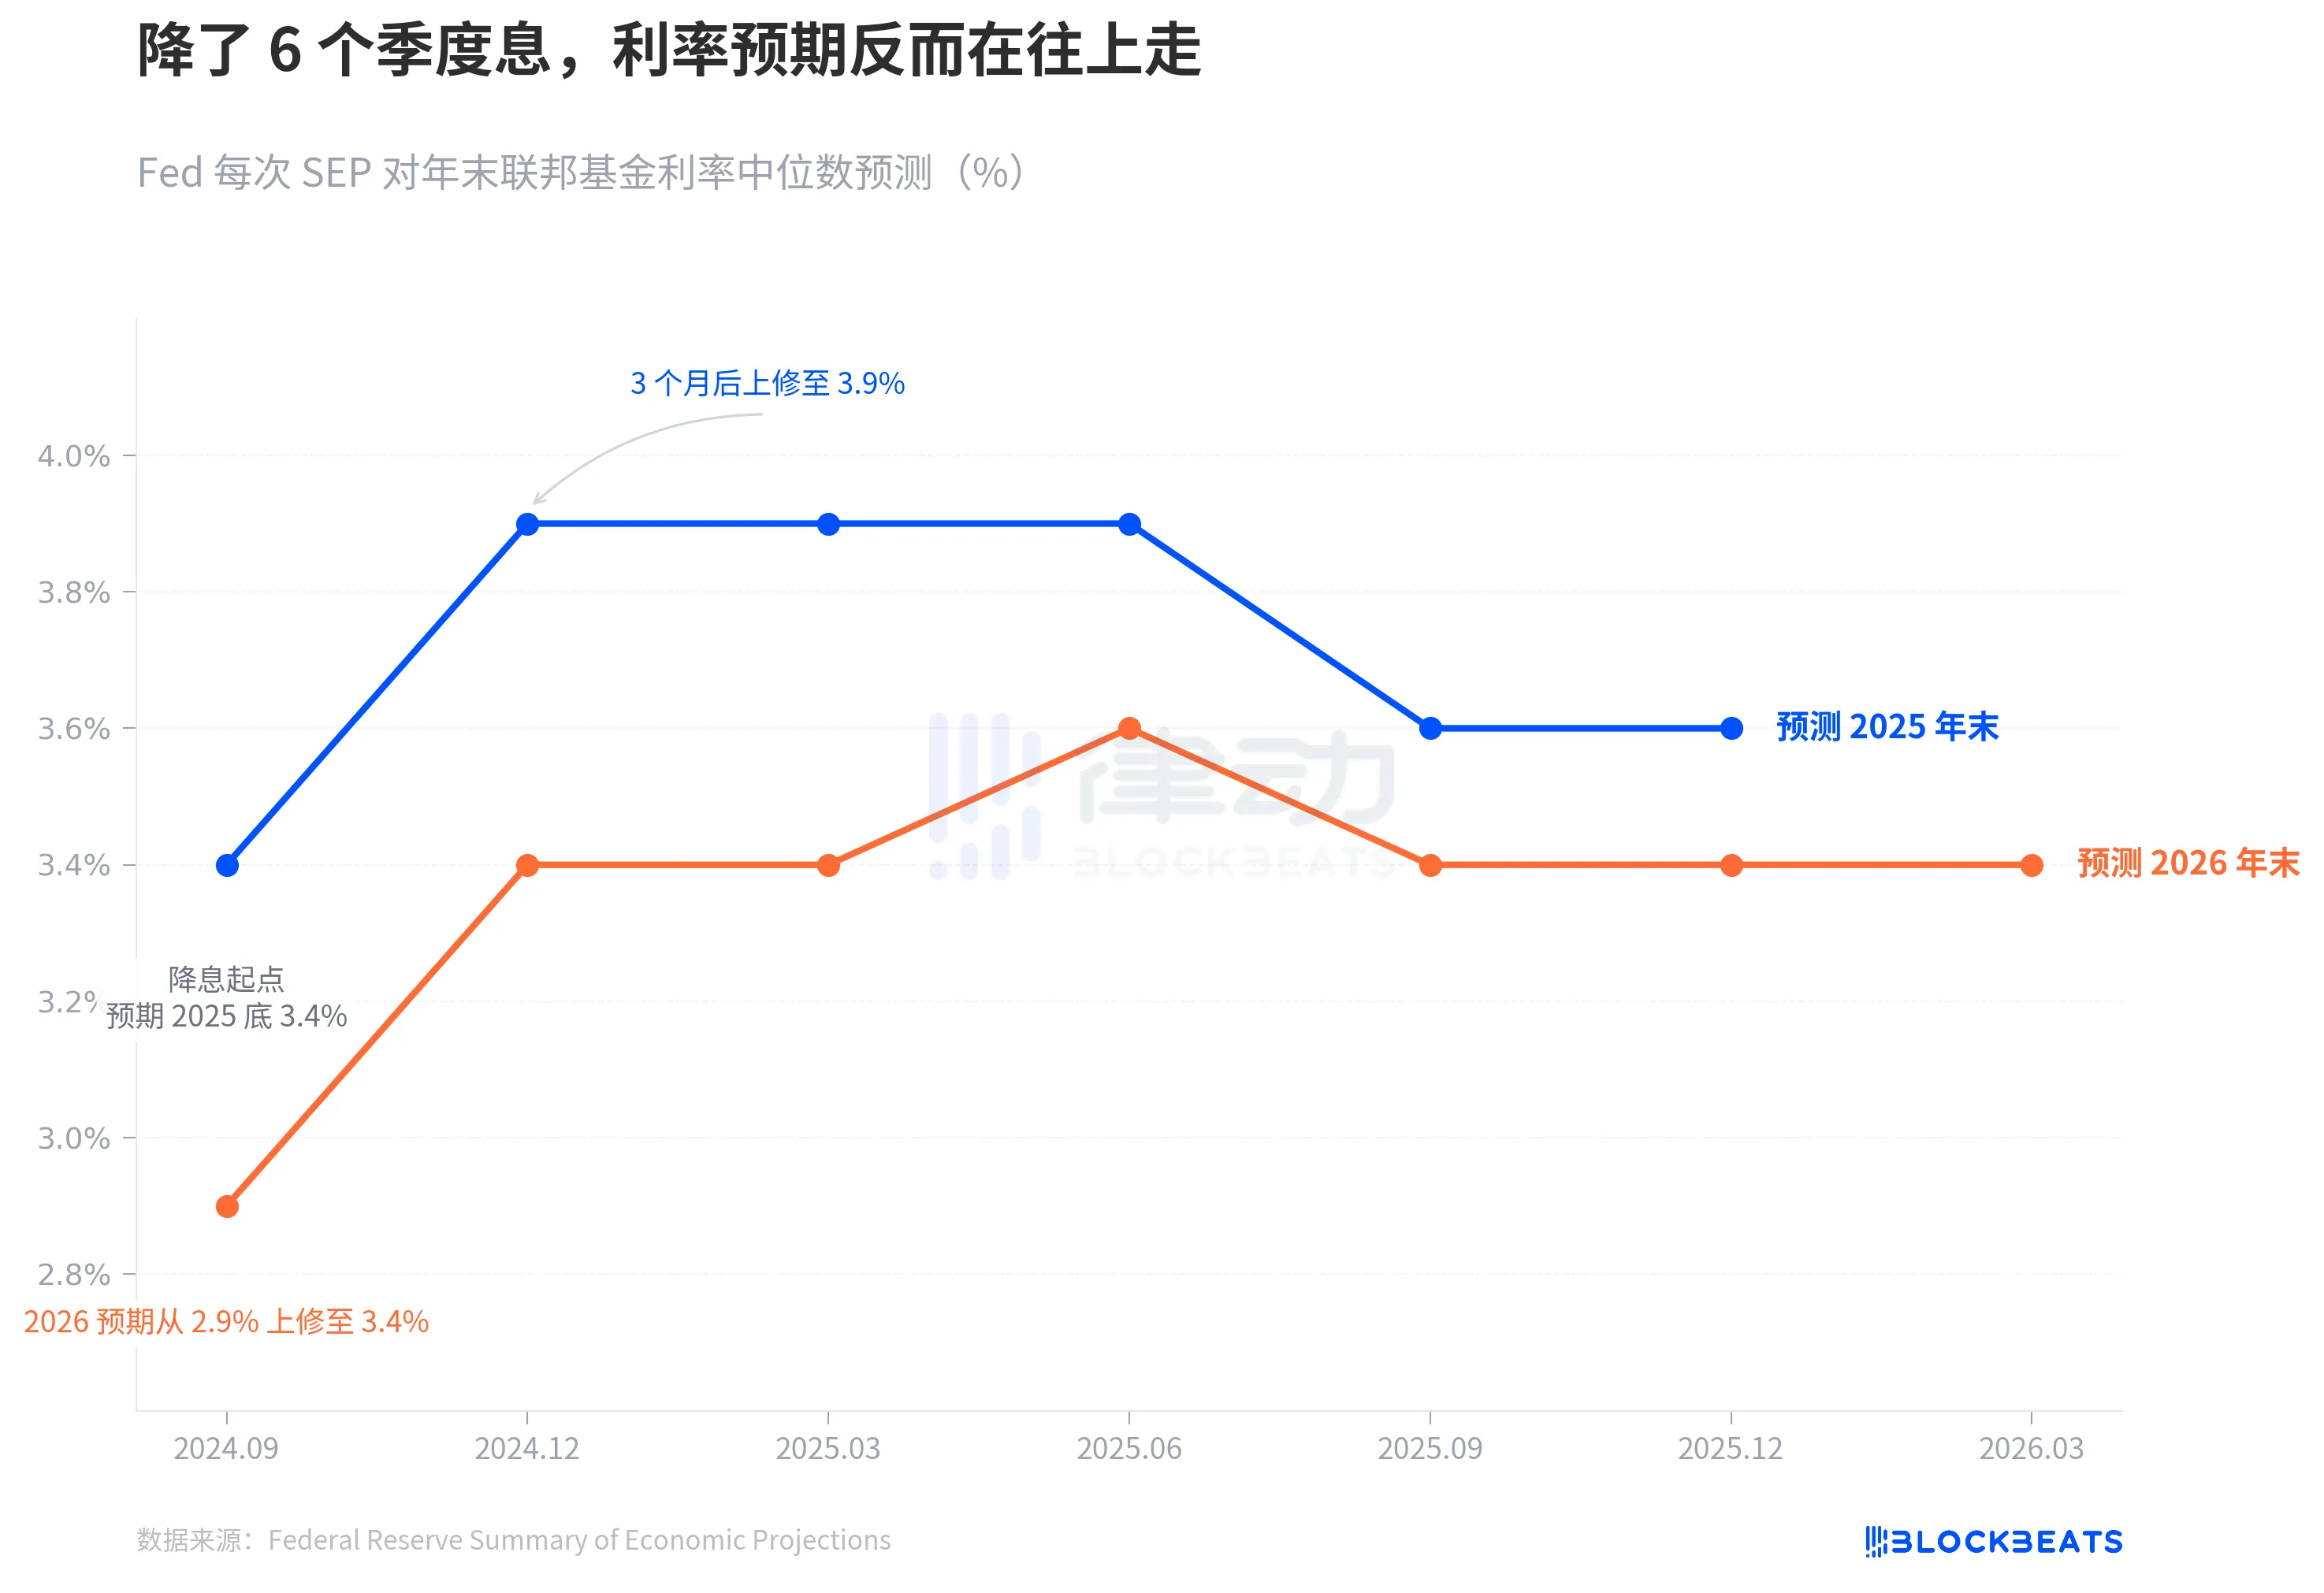
The trends of the blue line and orange line say the same thing: the rate cut cycle did start, but the Fed's own judgment on the rate endpoint kept moving up.
This drift speed is even more apparent in a longer time frame. In September 2024, the Fed had just lowered rates from a peak of 5.25%-5.50% to 4.75%-5.00%. At that time, the market was very confident in the rate cut path. CME FedWatch even gave an implied probability of 4-5 rate cuts in 2025. As a result, the Fed's own forecast jumped ahead—by December, halving the rate cut space, the blue line jumped from 3.4% to 3.9%, a single-quarter jump of 50 basis points. Since then, regardless of how economic data fluctuates, this line has not returned.
In other words, just 3 months into the rate-cutting cycle, the dot plot is already tapping the brakes on the rate-cutting path.
7:7, Fed Can't See Clearly
The median is a number that masks the division behind the number.
According to the Fed's March SEP Figure 2 dot plot (compiled by BondSavvy), the distribution of 19 participants' votes on the year-end 2026 rate is: 7 participants for no rate cut, 7 participants for 1 cut, 2 participants for 2 cuts, 2 participants for 3 cuts, and 1 participant for 4 cuts.
7:7, perfectly split. 14 participants are concentrated in the "maintain status quo" and "1 cut" categories, with only 5 participants expecting more than 1 cut.
Compared to the December 2025 SEP, the change is drastic. In December, 12 participants were still expecting 2 or more cuts, but by March, only 5 remained. Powell also confirmed this shift during the press conference: "4 to 5 participants moving from expecting 2 cuts to 1 cut."
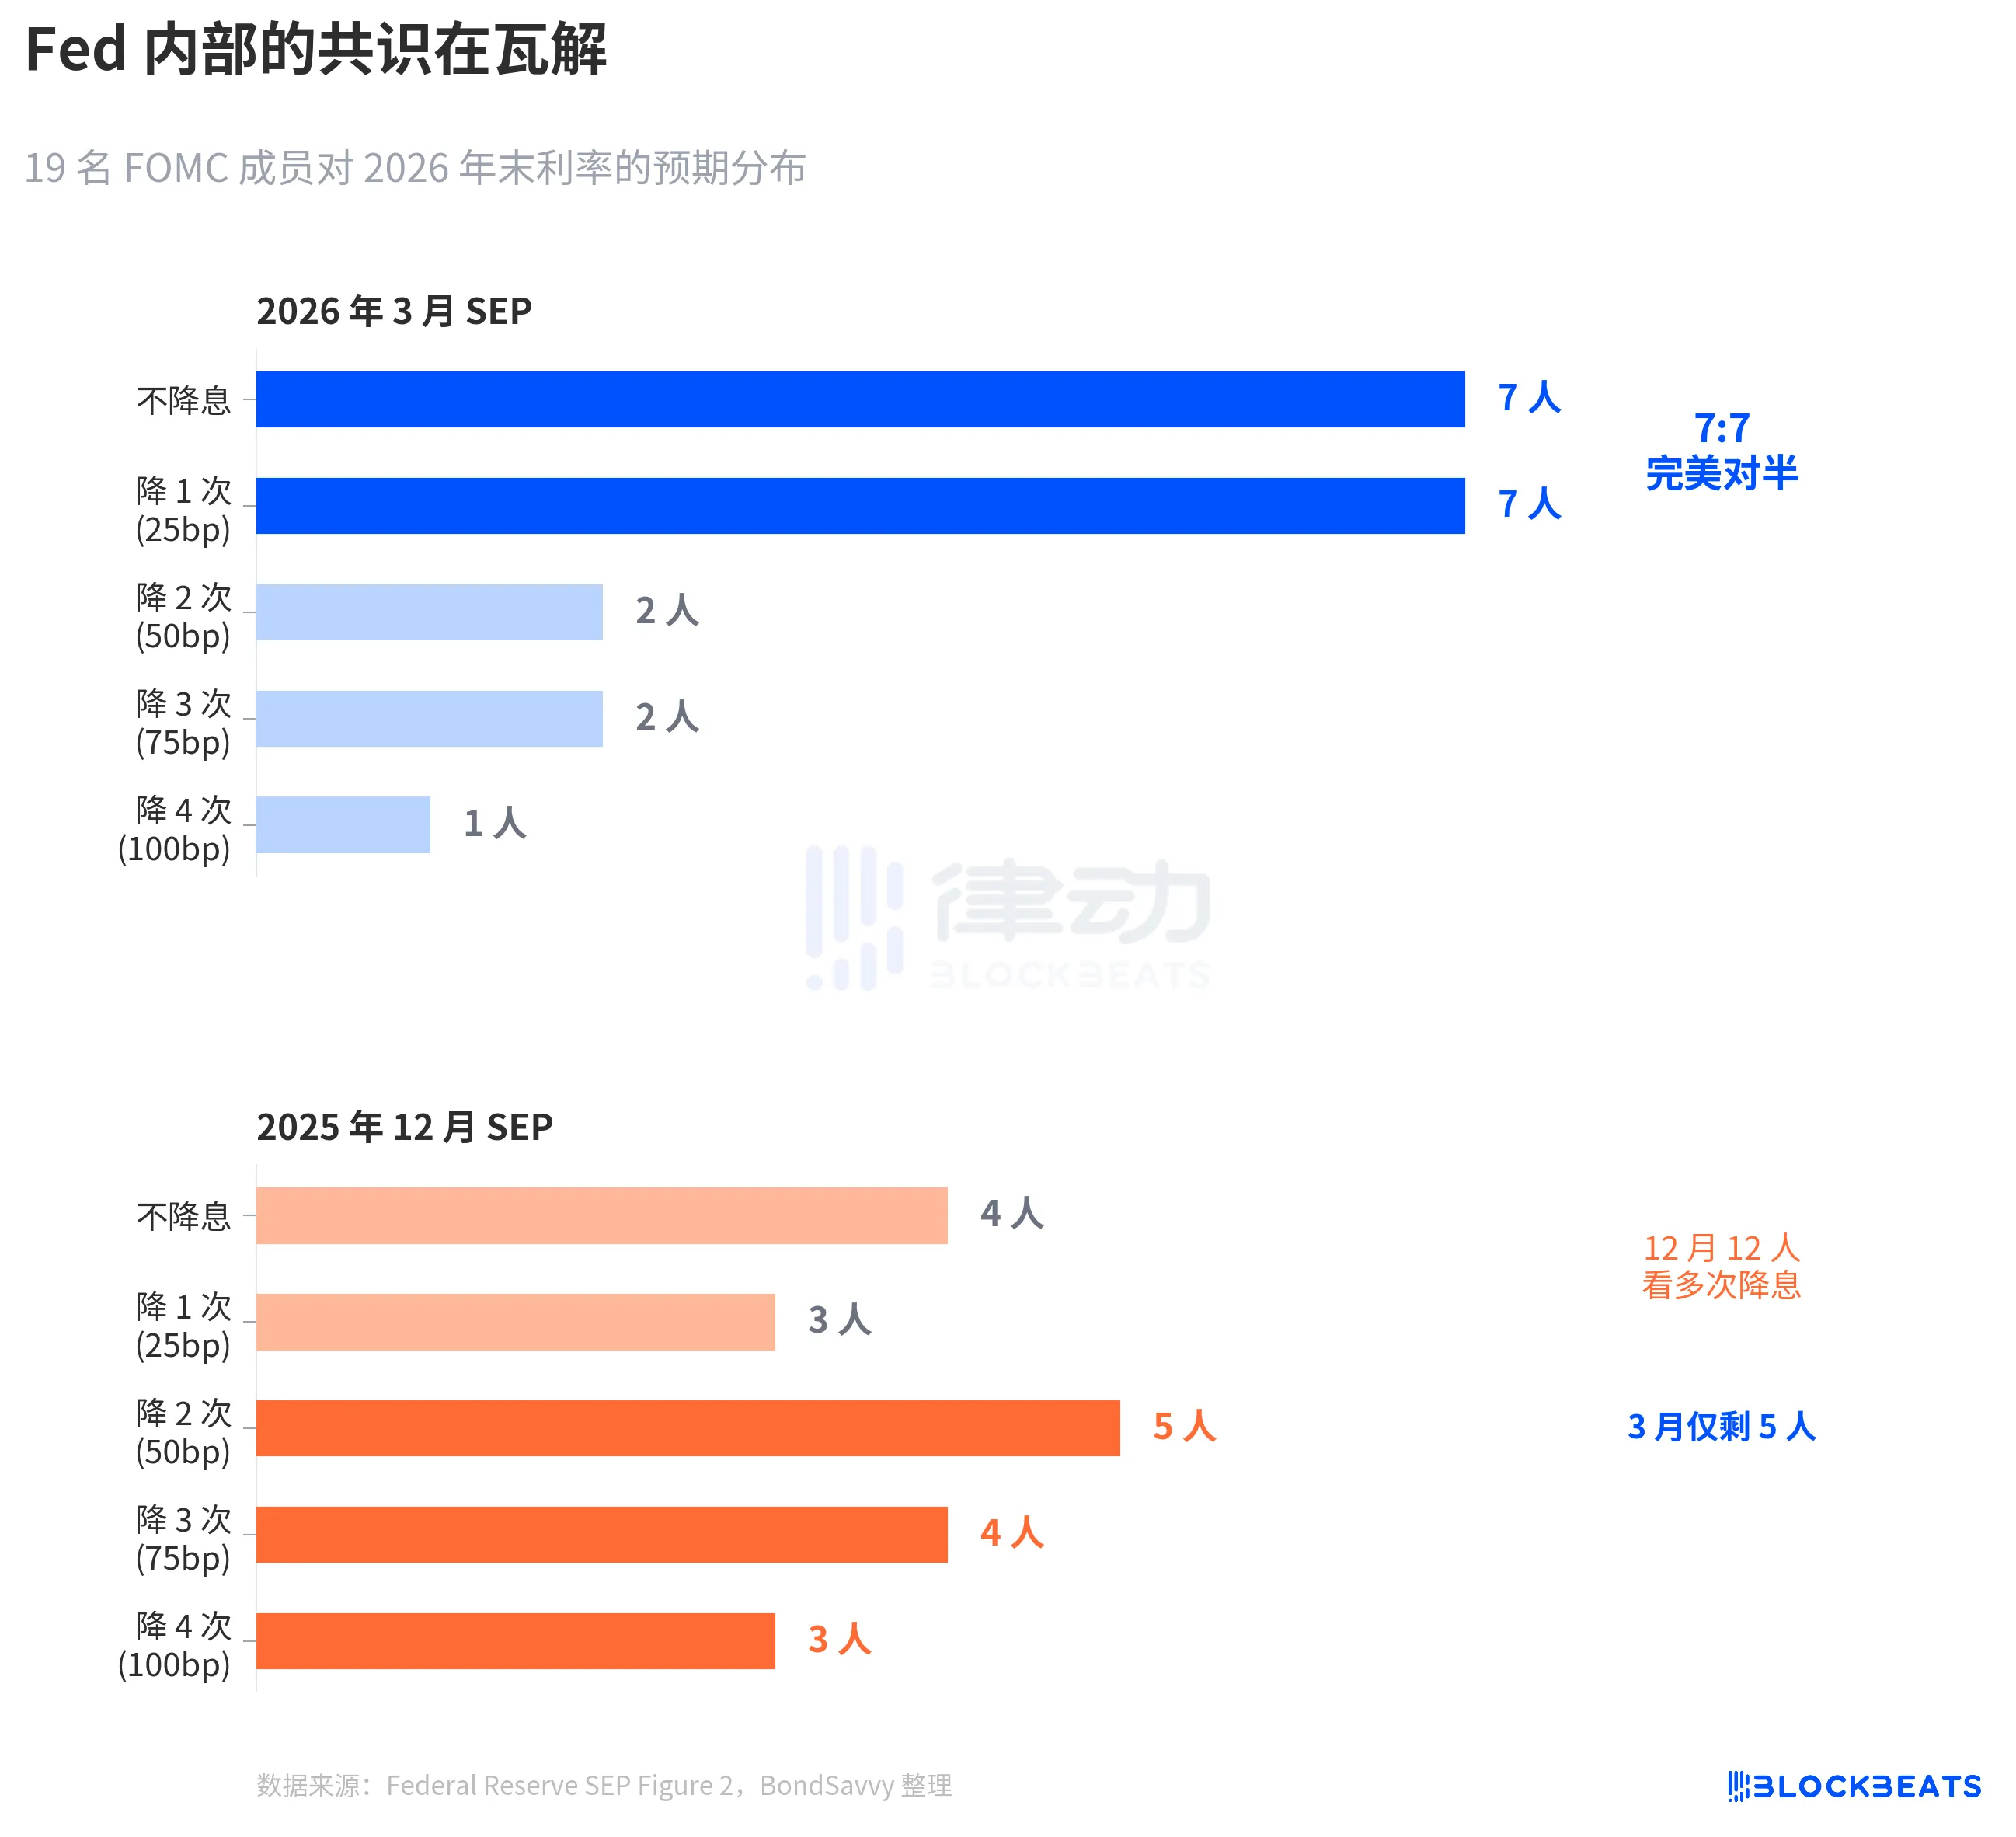
This symmetrical split is very rare in FOMC history. According to a 2023 study by the San Francisco Fed (Bundick & Smith), internal disagreements in the dot plot were nearly zero during the 2020 pandemic but gradually increased during the rate-hike cycle. However, past disagreements were mainly about the "magnitude"—whether to hike by 25 or 50 basis points, with the direction being consistent. The March 2026 disagreement is about the "direction": to cut or not.
The median of 3.4% remains unchanged, but beneath this 3.4%, two teams are pulling in opposite directions.
More notably is the way the distribution has narrowed. The December dot plot had a wide spread, with participants expecting anything from a significant cut to no change. In the March dot plot, the distribution has instead narrowed—14 dots huddled between two categories—but this is not consensus forming; it's each of the two opposing camps consolidating. Dispersed uncertainty has turned into concentrated disagreement. This is more dangerous than dispersion because any unexpected inflation data could cause one camp to collectively shift, leading to a median-jump.
Fed Always Underestimates Inflation
The root of the rate debate is the inflation debate.
According to various editions of the Fed's SEP data, in December 2024, the Fed first provided a 2026 PCE inflation forecast: 2.1%. This forecast was revised upward every quarter. In March 2025, 2.2%; June 2.4%; September 2.6%. It briefly fell back to 2.4% in December and then rose again to 2.7% by March 2026. Over 6 quarters, a cumulative upward revision of 0.6 percentage points.
This pattern is not new. 2025 saw an identical trajectory with PCE inflation. In December 2024, the Fed forecasted 2.5% for 2025 PCE, which was subsequently revised upward each quarter to 2.7%, 3.0%, 3.0%, 2.9%. According to the Bureau of Economic Analysis (BEA) data, December 2025 actual PCE YoY was 2.9%. The Fed spent a whole year catching up, barely matching it in the last quarter.
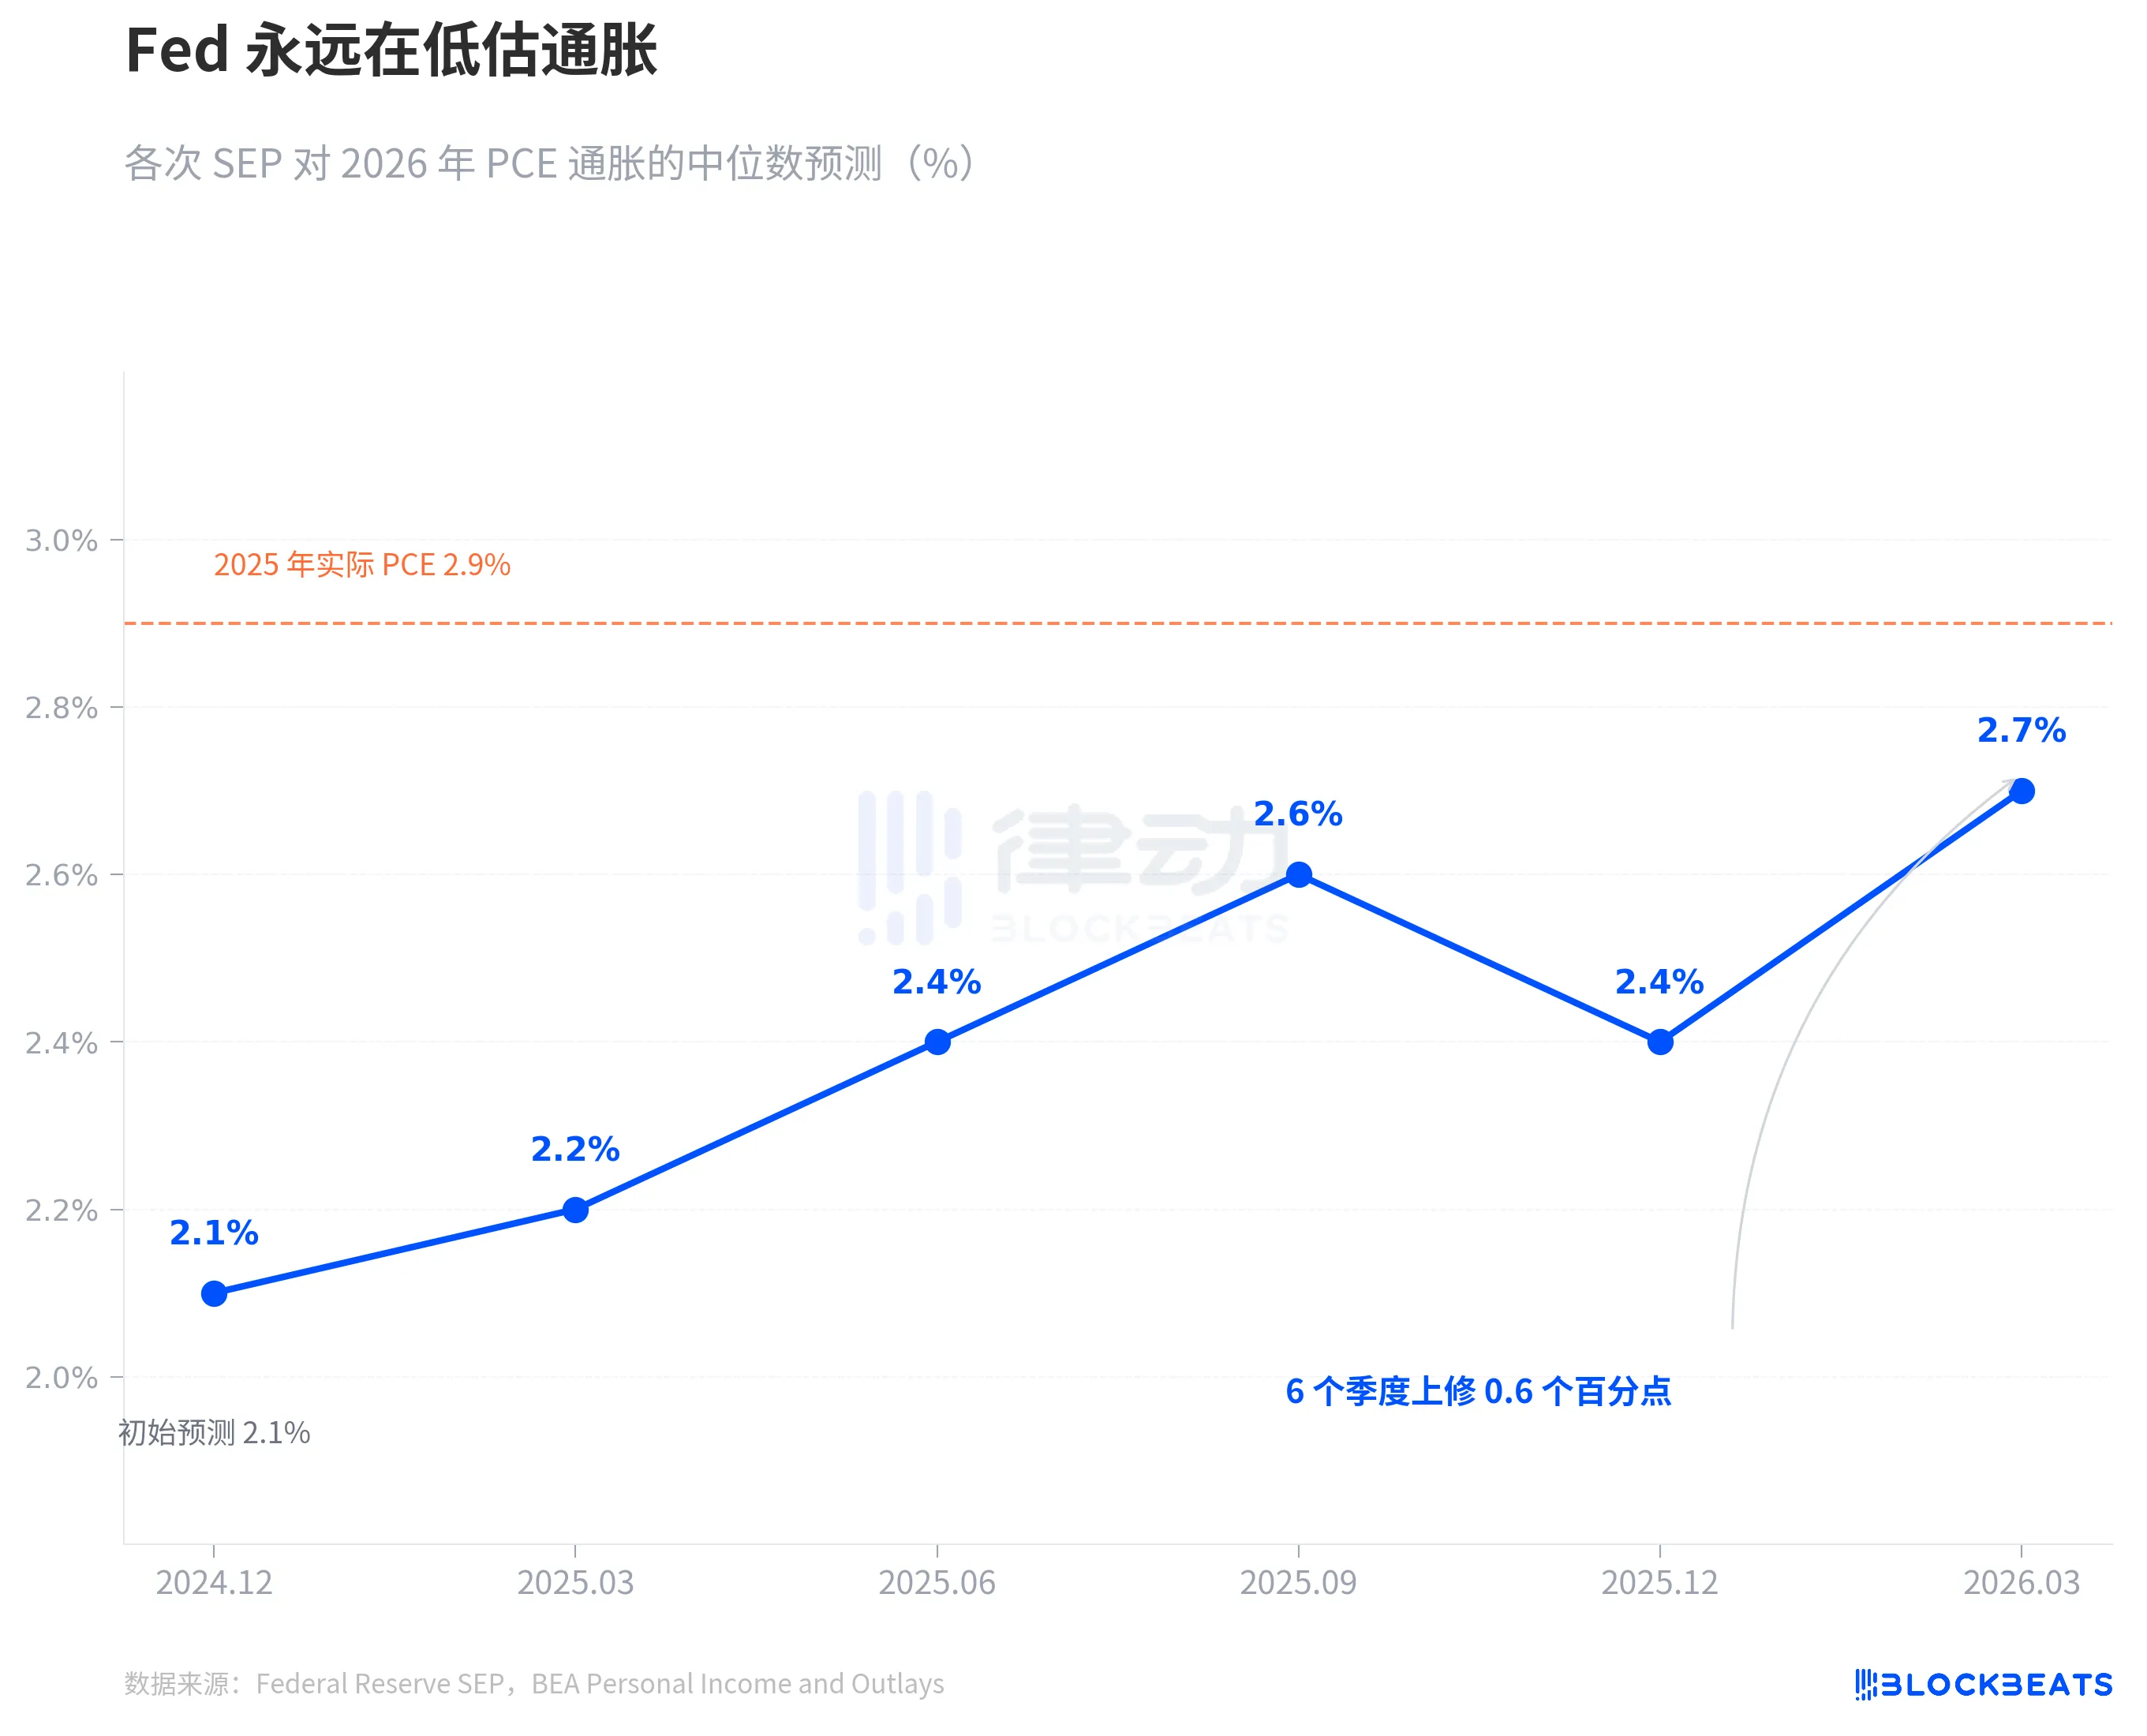
Now the Fed is saying 2026 PCE is 2.7%. The orange dashed line on the chart marks the actual value of 2.9% in 2025. Given their own track record, 2.7% is likely another starting point, not an ending point. Not a conspiracy, just a pattern. The Fed's real-time inflation forecasts have had only one direction in the past two years—upward revision.
What's worth separately noting is the core PCE. In March, the SEP raised the 2026 core PCE forecast from 2.5% in December to 2.7%, a quarterly increase of 0.2 percentage points, the largest adjustment among all indicators. Core PCE removes the volatility of food and energy and is considered by the Fed to be a more reliable inflation gauge. When the forecast for this indicator is revised upward, it indicates that the issue is not just about oil price fluctuations but that underlying inflation is stickier than expected.
In the same March SEP, the GDP forecast was slightly raised from 2.3% in December to 2.4%, while the unemployment rate remained unchanged at 4.4%. The economy is slightly stronger, inflation is more stubborn, yet the interest rate path remains unchanged.
There is tension among these three judgments. If inflation is more persistent than expected, why should the interest rate path remain unchanged? A 7:7 split provides the answer—it's not that the Fed thinks rates don't need to change; it's that the Fed's internal assessment of the inflation path itself is divided.
According to CME FedWatch data, the current market pricing for the full year of 2026 is: a 32.5% probability of a 50 basis point rate cut (2 cuts), a 25.9% probability of a 75 basis point cut (3 cuts), and a 21.1% probability of only 1 cut. The market-weighted expectation is around 50 basis points, more dovish than the Fed's median of 25 basis points. However, the gap between the most probable scenario and the Fed's median precisely reflects the Fed's internal 7:7 split.
No one knows the answer. Not even the Fed itself.
You may also like
Should You Buy Bitcoin Now? What the Data Says After a 50% Pullback
Founder of Baixing.com: I believe half of the statement that large language models devour everything
A "legal" robbery? Attackers emptied the BonkDAO treasury by buying tickets
How has Binance's stock business performed in the 30 days since its launch?
WEEX P2P now supports BDT & LKR—Merchant Recruitment Now Open
Morning News | SK Hynix officially launches the marketing promotion process for its U.S. stock listing; the Central Cyberspace Administration announces the results of the first phase of rectifying AI application chaos, with over 14,000 non-compliant pr...
Can Open USD support Stripe's ambitions?
Blockchain Capital Partner: AI is rewriting the fundamental unit of labor
The cryptocurrency industry has become a traditional industry
Chip frenzy cooling down? Morgan Stanley's Wilson: Funds are shifting towards AI supercomputing giants like Microsoft and Amazon
Morning Report | Vitalik outlines Ethereum's long-term roadmap, Lean Ethereum will become the third major iteration; SK Hynix seeks to attract more AI investors by listing in the U.S
Trump, the best stock trader among U.S. presidents
From ByteDance to Financial Freedom: How did "Byte Brother" Leto develop his investment judgment skills to achieve a turnaround of 30 million?
Selling coins despite a loss of 55 million dollars, the faith in Strategy has reached the interest payment date
OUSD False Cooperation Controversy? The Credit Game of Stablecoins and Endorsements by Giants
Q-Day Countdown: Will Quantum Computing End Cryptocurrency?
The ten years of Cloud on the Air: From corner coffee to global financial infrastructure
$10,000 in TRUMP Token vs. $10,000 in Nasdaq: The "Trump Trade" That Actually Worked in 2026
Should You Buy Bitcoin Now? What the Data Says After a 50% Pullback
Founder of Baixing.com: I believe half of the statement that large language models devour everything
A "legal" robbery? Attackers emptied the BonkDAO treasury by buying tickets
How has Binance's stock business performed in the 30 days since its launch?
WEEX P2P now supports BDT & LKR—Merchant Recruitment Now Open
Morning News | SK Hynix officially launches the marketing promotion process for its U.S. stock listing; the Central Cyberspace Administration announces the results of the first phase of rectifying AI application chaos, with over 14,000 non-compliant pr...


